
This webpage is for archival purposes only. It is no longer being maintained. Please see our new website at http://lib.berkeley.edu/EART
 |
 |
 |
 |


Introduction
National Ocean Service Charts
U.S. Coast Survey Charts
National Geospatial-Intelligence Agency Charts
Foreign Hydrographic Agency Charts
Other Marine and Ocean Maps
Introduction
Nautical charts are produced for marine navigation. They contain information on all navigational aids, such as buoys and beacons, lighthouses, radio and radar stations, shipping channels, and restricted areas. Some charts are issued with Loran-C plotting grids or great circle sailing tracks. Water depths are recorded as soundings--in meters, feet or fathoms. Near-shore depths are shown by contours and layered tints. In addition, physical features such as shorelines, shallows, reefs, submerged rocks, shipwrecks, kelp beds, and ocean bottom sediments, are shown in detail.
The Library collects nautical charts not primarily for their navigational information, but rather because they show coastal features and bathymetry. They can also serve as substitutes for street plans of coastal settlements and occasionally as general or topographic maps of coastal and island areas. For certain islands of the South Pacific, they provide the only topographical information available. Most charts in the collection are produced by two U.S. agencies: the National Ocean Service (NOS) and the National Geospatial-Intelligence Agency (NGA).
The National Geophysical Data Center (NGDC) is now the official distribution point for all the NOS bathymetric maps, bathymetric/fishing maps, regional maps, geophysical maps, and preliminary maps. NGDC also distributes digital bathymetric data for US coastal waters. The NGDC website includes an index, as well as online searching and ordering for all bathymetric, hydrographic, and seafloor relief data and maps.
National Ocean Service Charts
 The National Ocean Service (NOS) produces charts of domestic waters and, at earlier times, also produced charts of U.S. possessions. Information on purchasing U.S. nautical charts can be obtained from the NOS Office of the Coast Survey, which also provides digital access to some of their historic maps and charts. NOAA also makes their up-to-date charts available online through their On-Line Chart Viewer.
In 1807, President Thomas Jefferson created the Survey of the Coast. In 1836, it was renamed the U.S. Coast Survey. From 1878 until 1970, it was known as the U.S. Coast and Geodetic Survey. In 1970, the Survey was incorporated into the National Oceanic and Atmospheric Administration (NOAA); and its present name, National Ocean Service, was adopted in 1982. The Library is a Depository for all charts produced. Its collection includes charts from the late 1850s up to the present. They are used extensively, especially for studying historic changes of the San Francisco Bay shoreline features, such as coastal filling, dredging, and tidal marsh and channel changes. All charts are retained for
northern California. South of Monterey Bay, charts are retained at 10-year intervals. For all other states, only the oldest and most recent charts are kept. Scripps Institution of Oceanography at U.C. San Diego retains all historic editions for the entire United States.
View Catalog Record
U.S. Coast Survey Charts
The U.S. Coast Survey, between 1835-1927, mapped the U.S. coast and produced Topographic Survey maps and Hydrographic Survey maps. These preliminary maps were used as the basis for the first nautical charts produced (circa 1859). The scale of most are 1:10,000. The Earth Sciences & Map Library has a large set of the Topographic Survey Maps, mainly covering the California shoreline, with a few maps covering sections of the Atlantic coast. A complete set of maps for both the topographic and hydrographic surveys of California are retained by the California State Lands Commission in Sacramento. These preliminary maps are used extensively for historical studies of the San Francisco Bay area.
View Catalog Record
 Oakland, CA, 1857 |
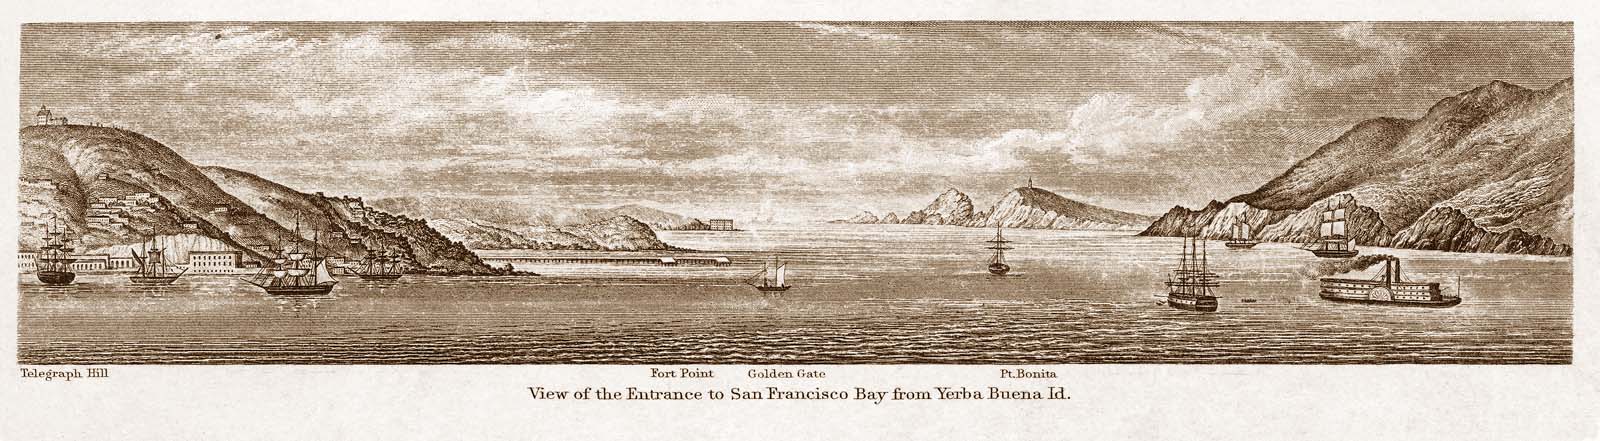
 Portion of 1st chart of San Francisco Bay, 1859 |
National Geospatial-Intelligence Agency Charts
The National Geospatial-Intelligence Agency (NGA)--formerly known as the National Imagery and Mapping Agency (NIMA), the Defense Mapping Agency (DMA), the U.S. Naval Oceanographic Office, and the U.S. Hydrographic Office--produces charts of foreign waters. The Library is a partial depository for many of the NGA/NIMA/DMA nautical charts. In general, the collection contains 20th century charts. For most areas of the world, only the oldest and most recent charts are retained. However, for areas of special interest, charts are retained at 10-year intervals.
View Catalog Record
| Papeete Harbor, Tahiti | |
 |
 |
| 1920 | 1986 |
Foreign Hydrographic Agency Charts
Except for pre-1800 charts, and those of the Pacific Coast of North America issued prior to 1875, foreign hydrographic agency charts are collected only when no U.S. chart of an area is available. For example, some areas in Mexico and Canada are covered only by Mexican and Canadian charts. Some of the foreign agencies whose charts are in the Earth Sciences & Map Library's collection are listed below:
- Argentina. Servicio Hidrografico.
- Great Britain. Admiralty.
- Canadian Hydrographic Service (CHS) digital products.
- India. Naval Hydrographic Office.
- Japan. Kaijo Hoancho. Suirobu (Hydrographic Office)
- Mexico. Dirección General de Faros e Hidrografía.
- Mexico. Dirección General de Oceanografía.
- Mexico. Dirección General de Oceanografía y Señalamiento Maritimo.
 Portion of Burma coast, 1990 India Naval Hydrographic Office (G9181.P5 svar.I5 Case B) |
 Hakodate Harbor, 1886 Japanese Hydrographic Office (G9096.P5 svar.J3 Case B) |
Other Marine and Ocean Maps
The collection contains many other types of oceanographic maps. Bathymetric maps show ocean depths by contours and gradient tints. Ocean bottom maps show the seafloor topography by shading or landform drawing. Still other maps show a variety of thematic subjects, such as marine climatology, ocean currents and temperature, fishing areas, offshore petroleum leases, marine ecological resources, and exploration routes.
 General Bathymetric Chart of the Oceans (GEBCO), 1984 / IHO (G3201.C2 s10000.F6 Case B) |
 Map of the Ocean Bottom Relief shown by shading and spot heights. (G9781.C2 1990.N3 Case D) |
 Plano del puerto de Sn. Francisco, 1766 / Jose de Canizares. (G4362.S22 1776.C4 Case D) |
![]() Return to Digital Tour of the Library's Map Collection
Return to Digital Tour of the Library's Map Collection